XRP Vs BTC - XRP/BTC Pair!
- Defend Dark
- Jun 14, 2022
- 1 min read
It is been a very long time since XRP depreciates against BTC. Almost every time frame indicates this picture clearly. However, the moves that XRP positioned in the early 2017 bull-run against BTC are approaching. This obvious 2017 pattern similarity could be observed with the below analysis.
Monthly XRP/BTC Chart
As we can see on the Monthly (M) Chart of the XRP/BTC pair, the dark blue resistances for both 2017 and 2022 are almost identical. The orange line below is the main support line since 2017. But what does this orange line and intersecting 2 blue lines forming 2 triangles tell us? Narrowing Triangles are heralding us a possible break-out which means, XRP is going to start appreciating against BTC.

This could be possible while XRP increase in price while BTC continue sideways or drop in price, or XRP stabilizes her position much better than BTC while they both depreciating.
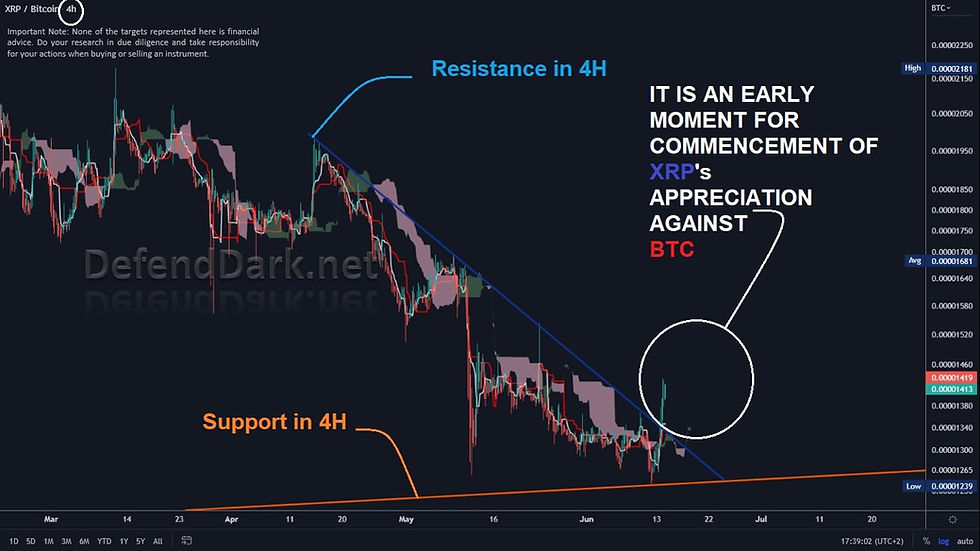
4 Hour XRP/BTC Chart
It is obvious that XRP started appreciating in the smaller time frames such as 4H. This can be the sparking moment for the big move of XRP appreciation against BTC.

As clearly seen above, XRP is breaking the initial Resistance against BTC. Since XRP is in the oversold in every time frames except Monthly Charts, this could be the driving factor for the upcoming price surge of XRP.

Comentários