The Wave 4 drop to the 38.2% at $231 and the Wave 5 surge past $1,000 — both drawn on the chart months before they happened.
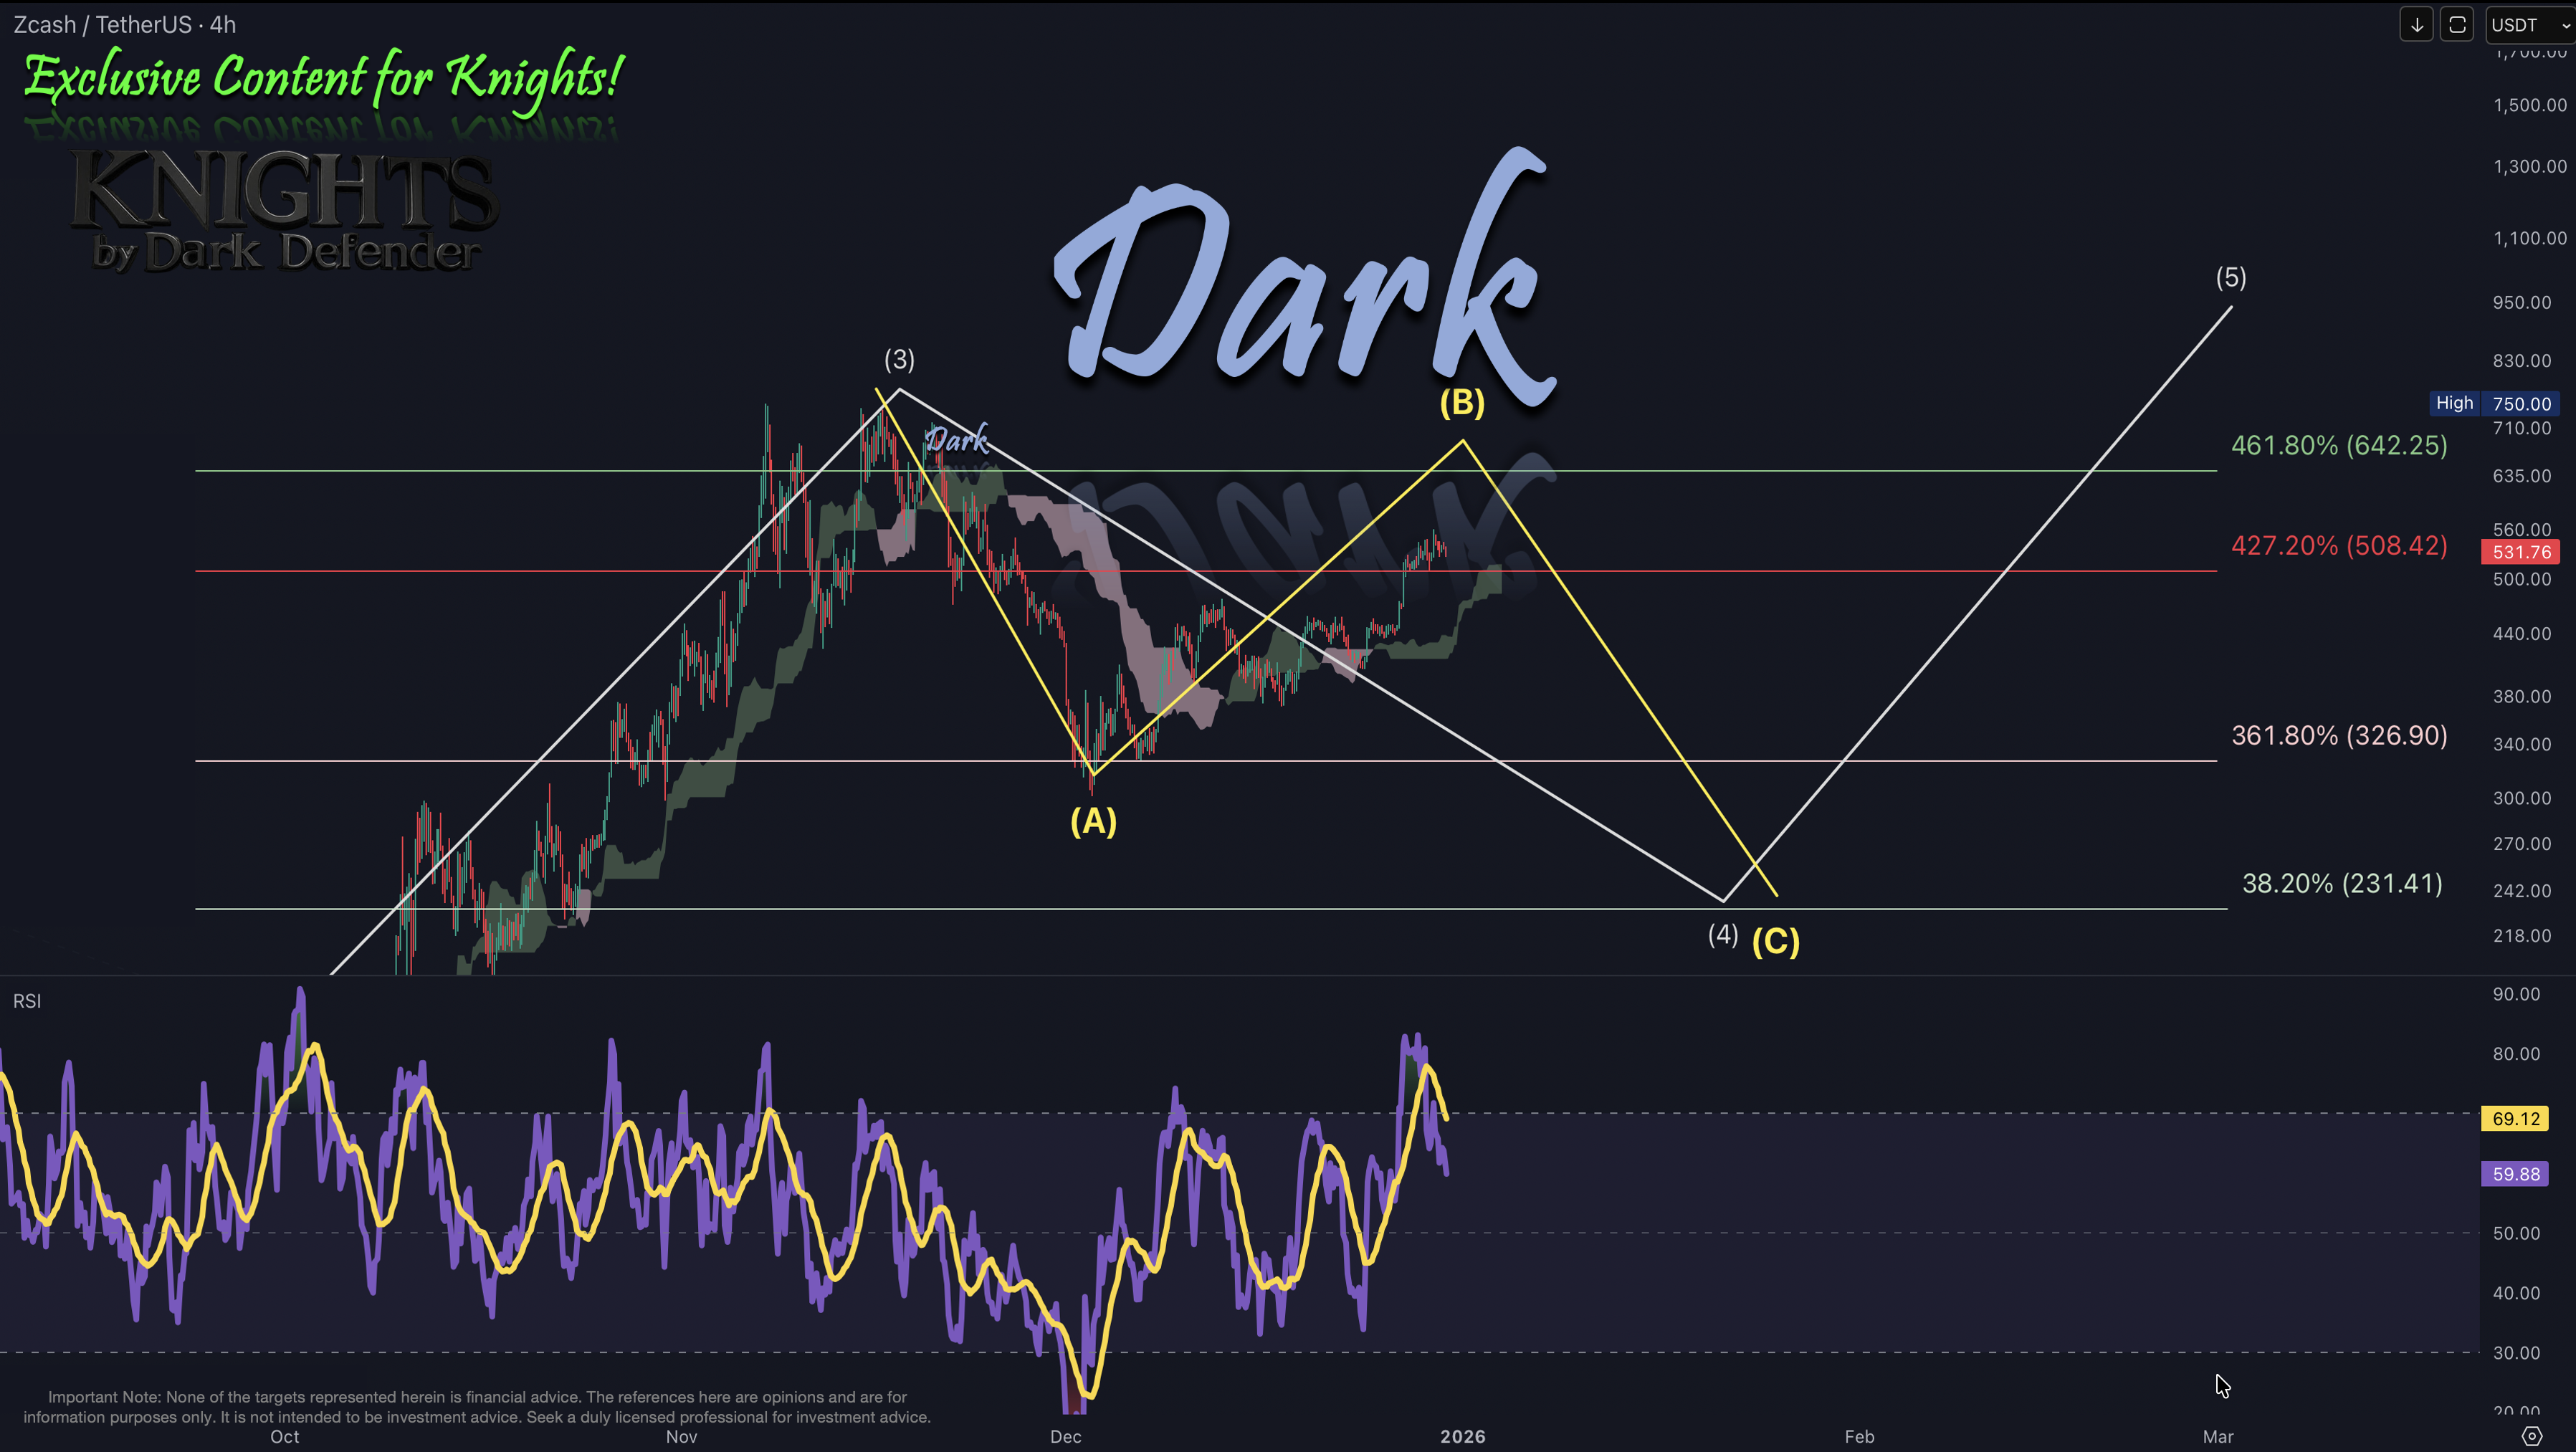
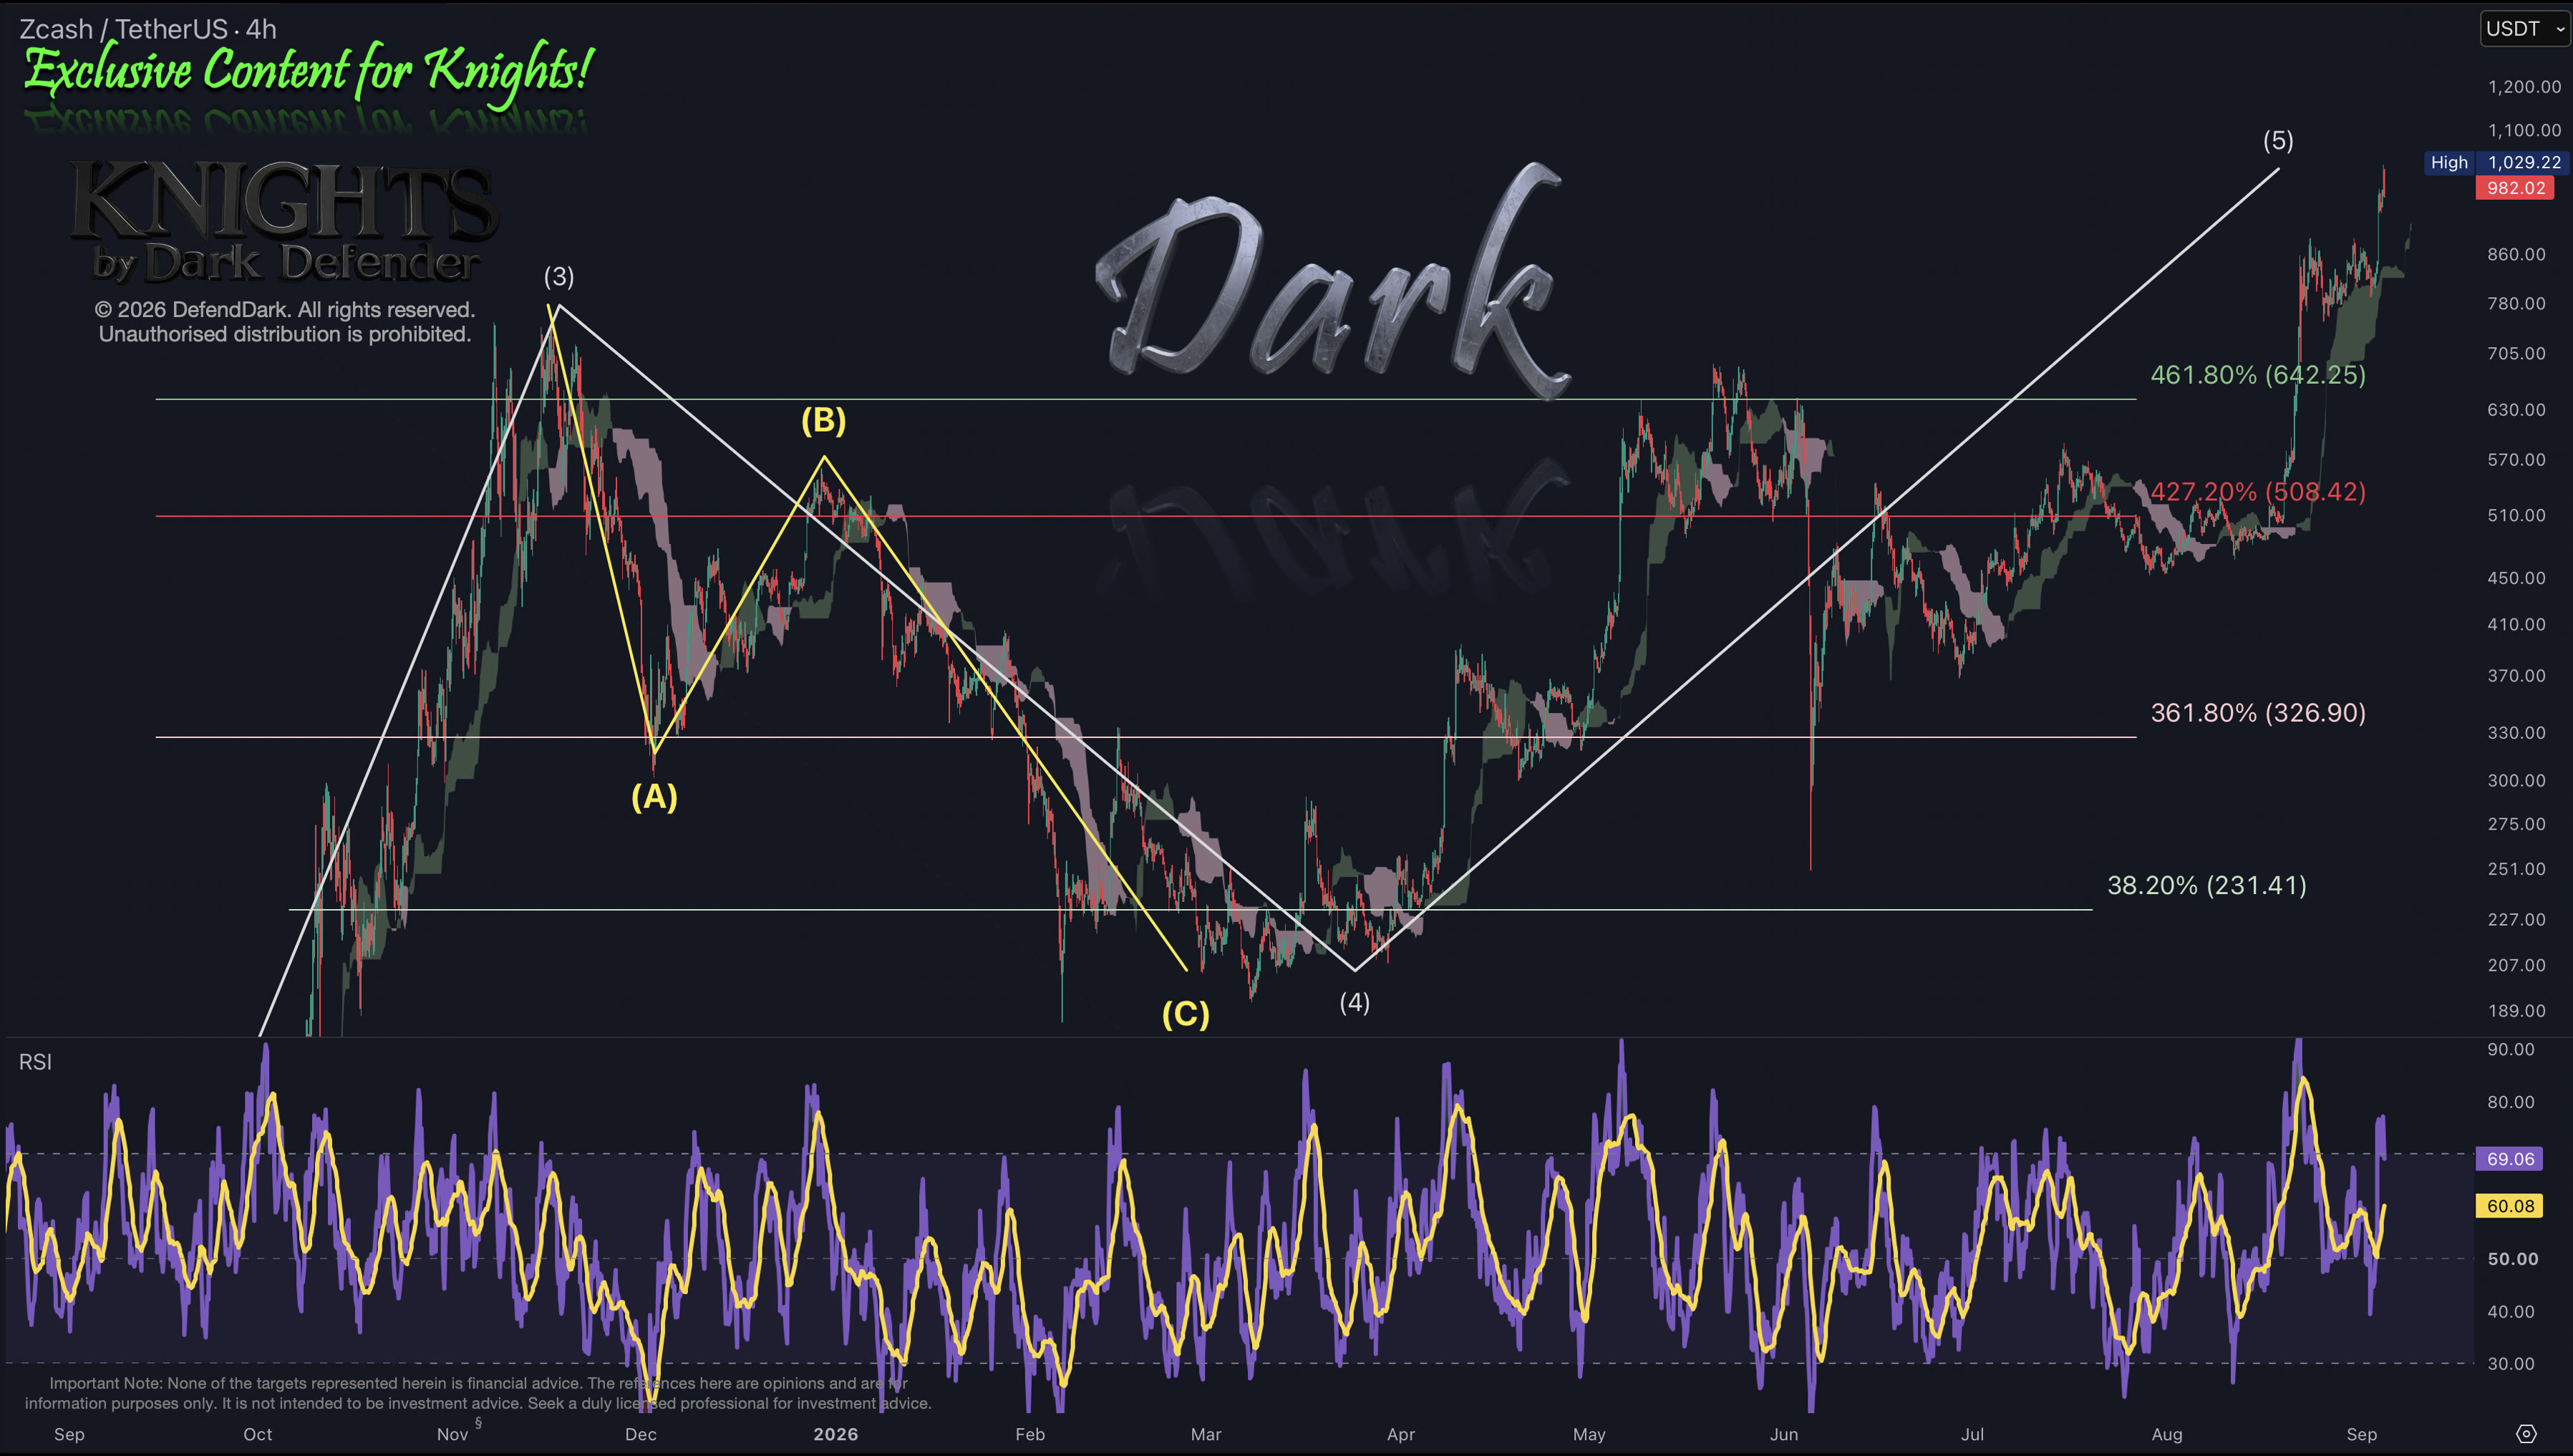
The CallZEC 4H · The Call, The Dark's SideRealisedZEC 4H · 03-Sep-2026, The Dark's Side
How precisely the structure was hit
With ZEC trading near $531, the 4-hour count mapped an ABC Wave 4 correction down to the 38.2% retracement at $231 — drawn on the chart while price was more than double that level.
Price dropped exactly into the marked zone — the Wave 4 low landed on the $231 line before reversing.
From that low, the projected Wave 5 advance unfolded leg by leg, reclaiming the 361.8%, 427.2% and 461.8% extensions in sequence.
By 3 September ZEC printed a high of $1,029 — through the projected Wave 5 target zone drawn months earlier.
Both the drop and the surge were documented in advance for Knights members — the same structure, start to finish, on one chart.
Not financial advice. These charts are shared for education and to document past analysis. Markets carry substantial risk and past structure is not a guarantee of future performance. Always do your own research.
 The Dark's Side